The NFT market in 2024 has experienced a significant downturn, with sales volumes reaching new lows. Despite the initial boom in the NFT space, recent trends indicate a sharp decline, affecting both sales volume and the overall market sentiment. For instance, NFT sales fell from their peak of $1.6 billion in March to just $374 million in August. This dramatic drop highlights the volatile nature of the NFT market and underscores the importance of monitoring NFT sales volume trends and market fluctuations. These shifts impact NFT collectors, crypto investors, and market analysts, shaping the future landscape of digital assets.
Overview of NFT Market Sales Trends in 2024
The NFT market experienced a roller-coaster ride in 2024, beginning with remarkable growth in the first quarter before entering a decline phase. In Q1, the market saw an unprecedented surge, reaching a peak sales volume of $1.6 billion in March. However, this momentum did not sustain, as subsequent months witnessed a steady decrease in NFT sales volumes. This overview aims to highlight the key turning points throughout the year, examining the factors driving both the initial growth and the subsequent downturn.
Q1 2024 – The Peak of NFT Sales Volumes
Q1 2024 was a period of exceptional growth for the NFT market, with total sales reaching $4.1 billion. This surge was fueled by increased buyer interest and several high-profile NFT launches that garnered significant attention from collectors and investors. During this time, NFTs became a major focus within the crypto space, leading to a surge in demand and higher trading volumes. Market enthusiasm was at an all-time high, as prominent collections and new entrants to the market drove record sales figures.
| Month | Sales Volume (in billions) | Growth Rate |
|---|---|---|
| January | $1.2 | – |
| February | $1.3 | +8% |
| March | $1.6 | +23% |
The comparative table illustrates the rapid growth in monthly sales volumes during Q1. March saw the highest spike, reaching $1.6 billion, largely due to factors such as increased media coverage, celebrity endorsements, and the launch of innovative NFT projects. This period marked the peak of NFT sales in 2024, setting a high benchmark for the rest of the year.

- Line Chart: Shows the trend in NFT sales volume over the months, highlighting the peak in March and the subsequent decline towards August.
- Bar Chart: Provides a clear visual comparison of the monthly sales volumes, with a noticeable sharp decline in August.
Decline Begins – April to June 2024
The beginning of Q2 marked a turning point, with NFT sales starting to decline in April. Sales volumes dropped to $1.2 billion in April, signaling the onset of a downward trend that continued throughout the quarter. By the end of Q2, NFT sales had plummeted to $2.24 billion, representing a 45% quarter-on-quarter decline. This decline was attributed to several factors:
Factors of Decline
- Decreased buyer interest: The surge in speculative buying during Q1 led to market saturation, causing a significant reduction in buyer enthusiasm in the following months.
- Market saturation: The influx of new NFT projects contributed to an oversupplied market, diluting the demand for individual assets.
- Increased market volatility: Broader economic conditions and crypto market volatility added to the uncertainty, prompting cautious behavior among investors and collectors.
These factors collectively contributed to the declining sales volumes, reflecting a shift in market dynamics from the exuberance of Q1 to a more cautious outlook in Q2.
Sharp Decline in August – The Yearly Low Point
August 2024 marked a critical low point for the NFT market, with sales volumes plummeting to $374 million. This was the first instance of monthly sales dropping below $400 million for the year, highlighting the severity of the market downturn. The sharp decline in August was a stark contrast to the market’s peak in March and signaled a period of intense market correction.
Key factors contributing to this decline included ongoing market saturation, a reduction in speculative trading, and the overall downturn in the cryptocurrency market. Major blue-chip NFT collections like CryptoPunks and Bored Ape Yacht Club saw their valuations drop by over 74% and 90%, respectively, indicating a broad-based impact across the market. This drastic fall underscored the volatile nature of NFTs, as prices adjusted to the changing market conditions.
Factors Contributing to the Decline in NFT Sales Volumes
The decline in NFT market sales volumes in 2024 can be attributed to several key factors. Market saturation, reduced speculative interest, and broader economic conditions have collectively played a significant role in this downturn. The NFT market, which once experienced unprecedented growth, now faces challenges that have reshaped its dynamics. These factors have led to a more cautious approach among investors, resulting in decreased trading volumes and lower valuations across the market.

- This chart shows the relative impact of various factors on the decline in NFT sales volumes.
- It highlights the significant role of market saturation, speculative capital shift, economic downturn, and market volatility. The values indicate the percentage impact, giving a clear view of which factors were more influential.

- This chart visualizes the declining trend of speculative interest and market activity over the quarters of 2024.
- It shows how both speculative interest and market activity have decreased steadily throughout the year. The line chart emphasizes the correlation between reduced speculative interest and the overall decline in market activity in the NFT space.
Market Saturation and Reduced Speculative Interest
In the early part of 2024, the NFT market saw an influx of new projects and collections, leading to an oversupply of digital assets. This rapid expansion created a saturated market environment, where the sheer volume of available NFTs diluted the demand for individual assets. Consequently, the market became overwhelmed with choices, making it harder for new and existing collections to maintain their value.
Moreover, the early enthusiasm for NFTs was fueled by speculative buying, with many investors seeking quick profits from rising prices. However, as the market matured, the speculative frenzy began to wane. Investors started shifting their capital to other emerging crypto assets, particularly memecoins, which offered the allure of high-risk, high-reward scenarios. This shift of speculative capital away from NFTs contributed to the reduced buyer interest in the NFT space, leading to a significant drop in sales volumes.
The reduced speculative interest resulted in a stabilization of NFT prices, but at lower levels than seen during the market’s peak. This correction indicated a market moving towards a more sustainable growth model, albeit with a significant contraction in sales volumes.
Economic Factors and Market Volatility
Broader economic factors and crypto market volatility have also played a crucial role in the decline of NFT sales. In 2024, the global economic landscape was marked by uncertainty, with inflationary pressures and potential recession risks affecting investor behavior. As a result, risk-averse sentiments began to dominate the financial markets, impacting not only traditional assets but also the crypto sector, including NFTs.
The decline in Bitcoin prices and overall market downturns in the crypto space created a ripple effect that reached the NFT market. When Bitcoin and other major cryptocurrencies experience volatility, the impact often extends to NFT sales, as many investors see NFTs as a high-risk asset class. As the crypto market faced downturns in 2024, liquidity within the NFT market dried up, leading to lower sales volumes and a decline in overall market activity.
In addition, macroeconomic factors such as interest rate hikes and tighter monetary policies in various economies contributed to the reduced flow of speculative capital into the NFT market. Investors, already cautious due to the uncertain economic environment, became less willing to invest in what they perceived as riskier digital assets. This cautious stance led to declining NFT volumes, highlighting how external economic conditions and market volatility directly affect the NFT sector.
Impact of Declining NFT Sales on Market Activity
The decline in NFT sales volumes in 2024 has had far-reaching effects on the broader market activity, significantly influencing transaction volumes, liquidity, and market sentiment. As NFT sales dwindled, the market experienced shifts that affected not just the price and trading volumes of digital assets but also the behavior of market participants. This section delves into these broader effects, highlighting how the fluctuations in sales volumes have led to changes in market dynamics.
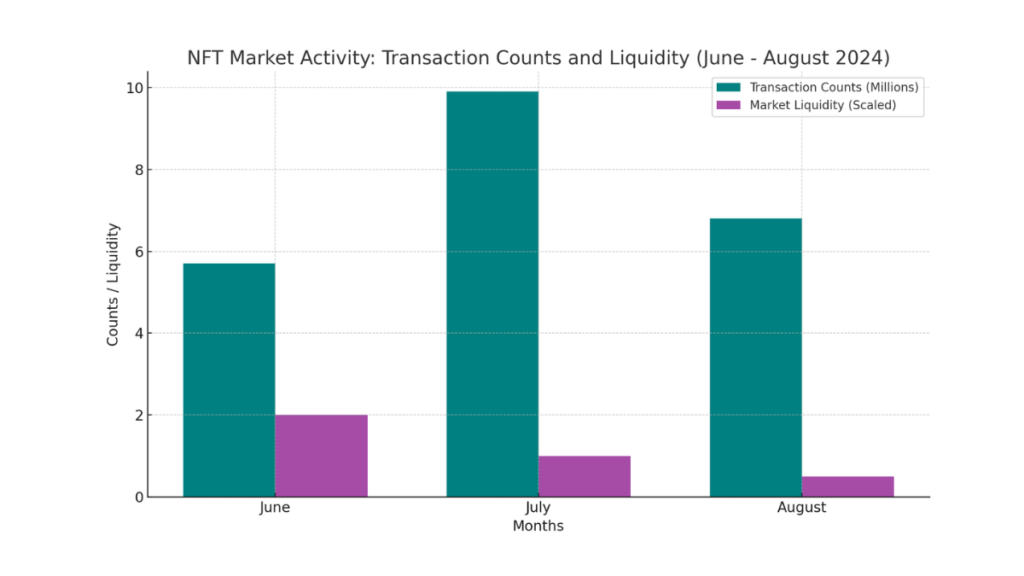
- This chart compares the transaction counts and market liquidity for the months of June, July, and August.
- The transaction counts are shown alongside the liquidity levels (scaled for visual purposes). It highlights the peak in transactions in July despite low liquidity, followed by a significant drop in August.
Fluctuating NFT Transactions and Market Liquidity
The downward trend in NFT sales volumes has had a direct impact on the number of transactions and overall market liquidity. Interestingly, while sales volumes saw a significant decline, transaction counts told a more complex story. In July 2024, despite a lower sales volume, the NFT market recorded a 73% increase in transaction counts, indicating heightened activity albeit with smaller transaction values. This anomaly suggested that while high-value transactions decreased, smaller and more frequent trades continued to occur, potentially driven by speculative trading in lower-valued NFTs.
However, this surge in transactions was short-lived. By August, the market saw a sharp 31% drop in transaction counts, aligning with the broader decline in sales volumes. The decrease in both transaction volumes and liquidity reflects the challenges the NFT market faces. When sales volumes decline, liquidity often dries up, as there are fewer buyers and sellers actively trading. This reduction in liquidity can lead to higher price volatility, further dampening investor confidence and participation.
| Month | Transaction Count (Millions) | Market Liquidity |
|---|---|---|
| June | 5.7 | Moderate |
| July | 9.9 | Low (Despite High Transactions) |
| August | 6.8 | Declining |
The table above illustrates the fluctuation in transaction counts and the impact on market liquidity. The rise in July followed by a significant drop in August underscores the market’s vulnerability to changing investor sentiments and market conditions.
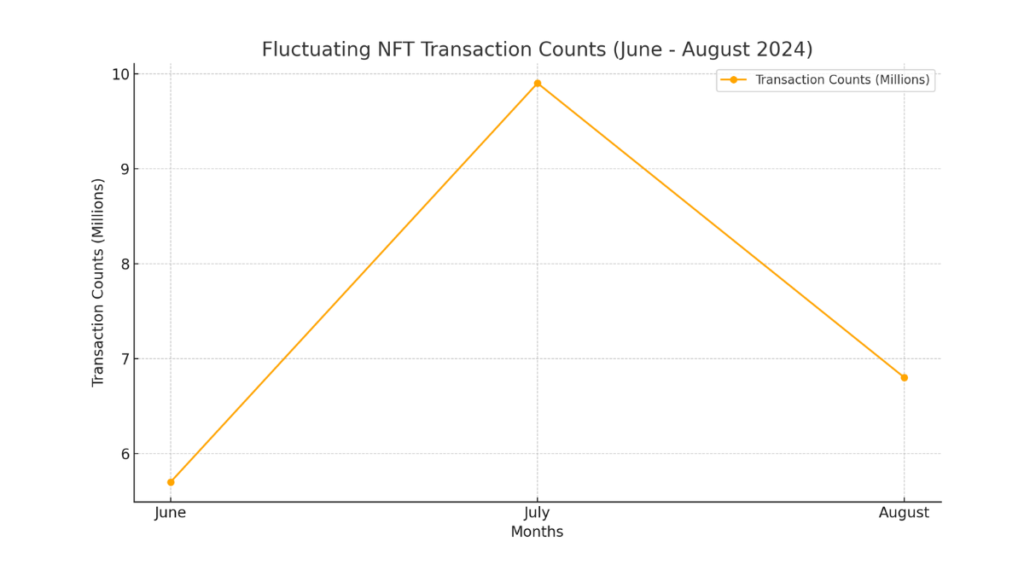
- This chart visualizes the trend in transaction counts over the three-month period.
- It shows a sharp rise in July, followed by a 31% drop in August, emphasizing the market’s fluctuating nature.
Shifting Market Sentiment and Buyer Behavior
The decline in NFT sales volumes has significantly influenced market sentiment, leading to a noticeable shift in buyer behavior. As sales volumes decreased, market participants became more cautious, often waiting on the sidelines rather than engaging in speculative buying. This shift in sentiment resulted in a more conservative market approach, with a focus on quality over quantity.
One of the key trends observed during this period was an increase in the average NFT sale values, despite the overall decline in sales volumes. This increase indicates that while the number of transactions decreased, buyers started focusing on acquiring high-quality, potentially long-term valuable NFTs. This change in buyer behavior marks a departure from the speculative frenzy of earlier periods, suggesting a maturing market where investors are becoming more discerning about their NFT investments.
The change in market sentiment and buyer behavior also reflects a broader shift in market dynamics. Investors have moved away from speculative activities towards a more value-driven approach, prioritizing NFTs with perceived intrinsic value or long-term potential. This behavior is indicative of a market in transition, where participants are adapting to the new realities of a more volatile and uncertain market landscape.
Recent Signs of Recovery in NFT Market Volumes
Despite the overall declining trend in NFT sales throughout 2024, there have been recent signs of recovery in the market. Improvements in weekly sales volumes across major blockchains indicate a potential resurgence in the NFT space. These signs of recovery suggest a growing interest among buyers and an increase in market activity, bringing a sense of optimism to the NFT community.
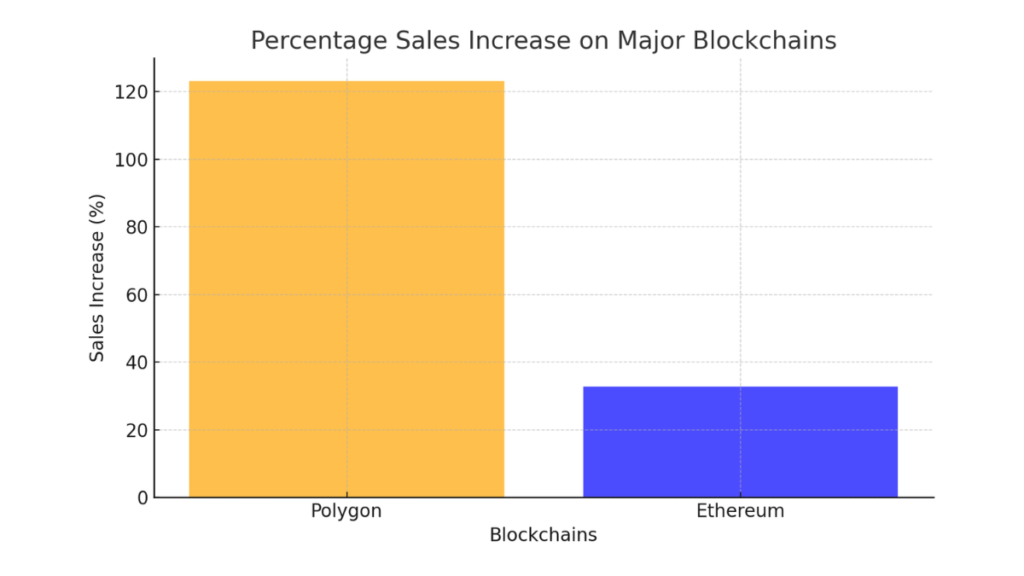
- This chart shows the percentage increase in NFT sales on Polygon and Ethereum, highlighting Polygon’s significant growth of 123.20% compared to Ethereum’s 32.79%.
- It provides a clear visual comparison of the resurgence in sales on these two major blockchains.
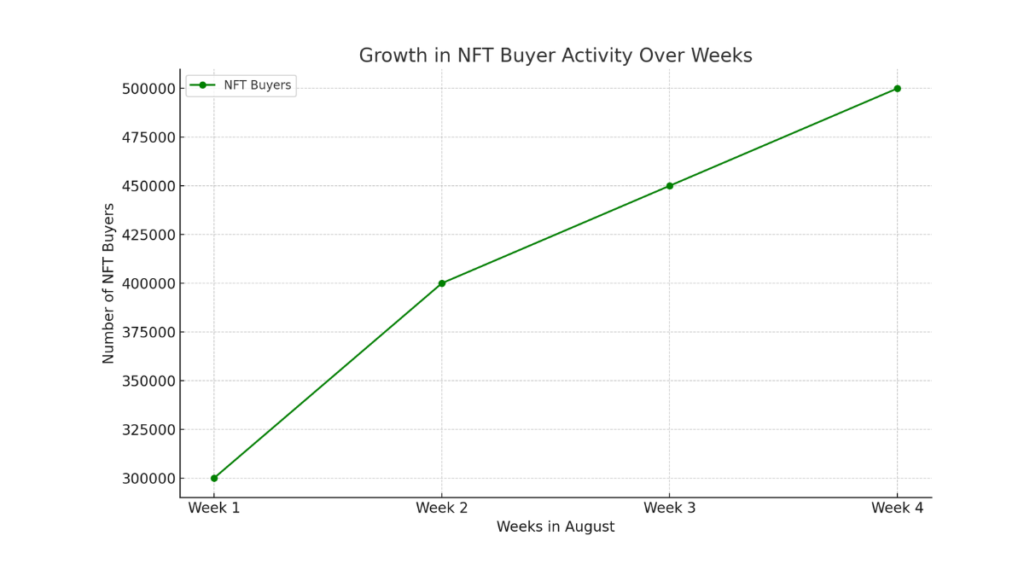
- This chart illustrates the increasing number of NFT buyers over four weeks in August.
- The upward trend in buyer numbers indicates growing interest in the NFT market, with the count reaching 500,000 by the fourth week.
Weekly Volume Increases Across Major Blockchains
In late 2024, the NFT market has shown resilience with notable increases in weekly sales volumes, particularly on blockchains like Polygon and Ethereum. This rebound indicates a resurgence in buyer interest and market activity. Notably, some new collections have performed remarkably well despite the broader market downturn. For instance, Infinex’s new Patron NFT collection amassed over $40 million in sales within the first four days of its launch, showcasing a significant uptick in market activity despite the sluggish performance of other top NFT collections. Additionally, Infinex surpassed $150 million in total value locked (TVL) during its launch season, attracting substantial investment from major foundations and venture capital firms.
A key indicator of recovery can be seen in the growth rates across different blockchains:
- Polygon: Experienced a sales increase of 123.20%, signaling renewed interest and activity on the network.
- Ethereum: Saw a 32.79% sales increase, further highlighting the resilience of the NFT market on this major blockchain.
Note
This rise in sales volumes indicates that while the market has faced a significant downturn, there are still areas of growth and potential, especially with new projects and collections capturing investor interest.
Alongside the increase in sales volumes, there has been a noticeable growth in NFT buyer activity. In recent weeks, NFT sales have steadily risen, with a 32% increase in trading volumes observed in October compared to September. Moreover, the market recorded over 500,000 buyers in a single week in August, suggesting a shift in market dynamics. This surge in buyer activity indicates a renewed interest in NFTs, potentially driven by a mix of factors, including rising cryptocurrency prices and increased market optimism.
These developments imply a potential comeback for NFTs, where both prices and sales are on the rise. Prominent NFT projects have also seen escalating floor prices. This recovery in buyer activity suggests that the market is not only attracting new participants but also reviving interest among existing collectors and traders, leading to more dynamic market activity.
Read More
- Impact of US Inflation Data on Crypto
- Market Effects of DeFi TVL Decline
- Major Exchange Token Listings
- Trading Volume Trends in DeFi
The NFT market in 2024 has experienced significant fluctuations, with sales volumes declining sharply before showing recent signs of recovery. Despite challenges such as market saturation and reduced speculative interest, there is growing optimism in the market due to increased weekly sales volumes and renewed buyer activity. These developments indicate that while the NFT market faces volatility, it remains resilient and adaptable, suggesting potential for future growth in more mature and diversified forms.


