In Q2 2024, Ethereum became inflationary for the first time since 2022. This was due to lower ETH burn rates after the Dencun upgrade in March 2024. This inflationary trend marks a critical shift for Ethereum’s economic model. Emissions began to outpace burns due to decreased network activity and low gas fees. Ethereum developers and blockchain analysts must grasp this shift. It reveals key changes in the network’s burn-to-emission ratio and the forces shaping Ethereum’s supply.
The Role of the Dencun Upgrade in Ethereum’s Inflationary Shift
The Dencun upgrade, which went live in March 2024, changed Ethereum’s transactions. This upgrade introduced “blobs” that temporarily store transaction data. It enabled Layer 2 (L2) solutions to process transactions more efficiently and cheaply. It cut gas fees. But, it reduced network activity and ETH burn rates. This shifted Ethereum from deflationary to inflationary.
Lowered Transaction Costs Post-Dencun
Ethereum’s gas fees were significantly reduced following the Dencun upgrade, particularly for Layer 2 networks. By using blobs to package transactions, the network managed to lower the cost of each transaction. Consequently, gas fees dropped to as low as 1.9 gwei during Q2 2024, a stark contrast to the higher fees seen before the upgrade.
| Time Period | Average Gas Fee (Gwei) |
|---|---|
| Q1 2024 | 98 Gwei |
| Post-Dencun Q2 2024 | 8 Gwei |
| Lowest Q2 2024 | 1.9 Gwei |
Lower gas fees made transactions cheaper for users. But, fewer ETH tokens were burned, which increased the supply.
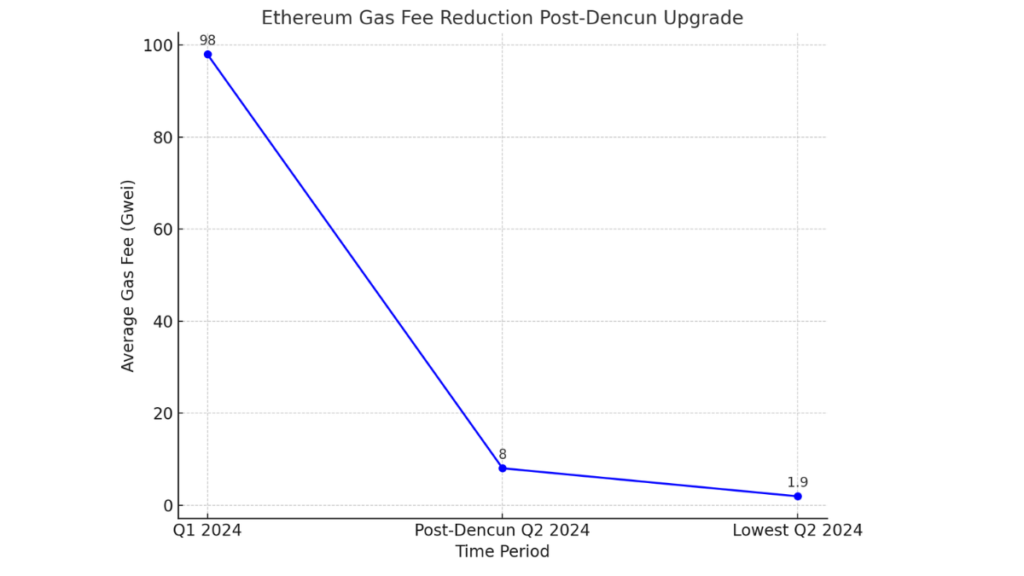
Here is a line chart visualizing the gas fee reduction on Ethereum post-Dencun upgrade. It clearly shows the sharp decline in gas fees from Q1 2024 to the lowest point in Q2 2024.
Impact on Network Activity
The reduction in transaction costs directly impacted Ethereum’s network activity. With cheaper gas fees, users and protocols used Layer 2 solutions more. This lowered the number of transactions on Ethereum’s mainnet. As a result, the burn rate decreased significantly, from 398,061 ETH in January 2022 to much lower figures in Q2 2024. This cut in transactions worsened Ethereum’s inflation. Fewer fees were burned per block.
The Declining ETH Burn Rate and Its Effects on Supply
In Q2 2024, Ethereum’s burn rate fell. It had its first inflationary quarter since 2022. Only 107,725 ETH were burned, while 228,543 ETH were emitted, resulting in a net supply increase of 120,818 ETH. This was mainly due to reduced network activity and lower gas fees. Both led to fewer transactions and lower ETH burns.
The Burn-to-Emission Ratio
Ethereum’s burn-to-emission ratio changed. This was due to lower network usage and transaction volumes. The EIP-1559 mechanism, which burns a portion of transaction fees, was directly impacted by this drop in activity. As fewer transactions were processed on the mainnet, fewer fees were burned, while emissions continued at a steady pace. This imbalance caused Ethereum’s inflationary phase. It was due to high burns and low emissions.
Top ETH Burners in Q2 2024
Despite the decline, certain protocols remained the top ETH burners in Q2 2024. Uniswap led the charge with 71,915 ETH burned, though its burn rate dropped by 72.4% compared to Q1. ETH transfers and Tether also played significant roles, burning 33,538 ETH and 23,332 ETH, respectively. Other notable contributors included platforms like Banana Gun and Maestro, which together burned over 20,000 ETH. However, lower DEX activity and other factors cut burn rates.
| Protocol/Method | ETH Burned in Q2 2024 |
|---|---|
| Uniswap | 15,031 ETH |
| ETH Transfers | 6,838 ETH |
| Tether | 5,091 ETH |
| Banana Gun | 2,150 ETH |
| Maestro | 1,945 ETH |
Note
This drop in burn rates shows lower network activity and gas use. It adds to Ethereum’s inflationary supply.
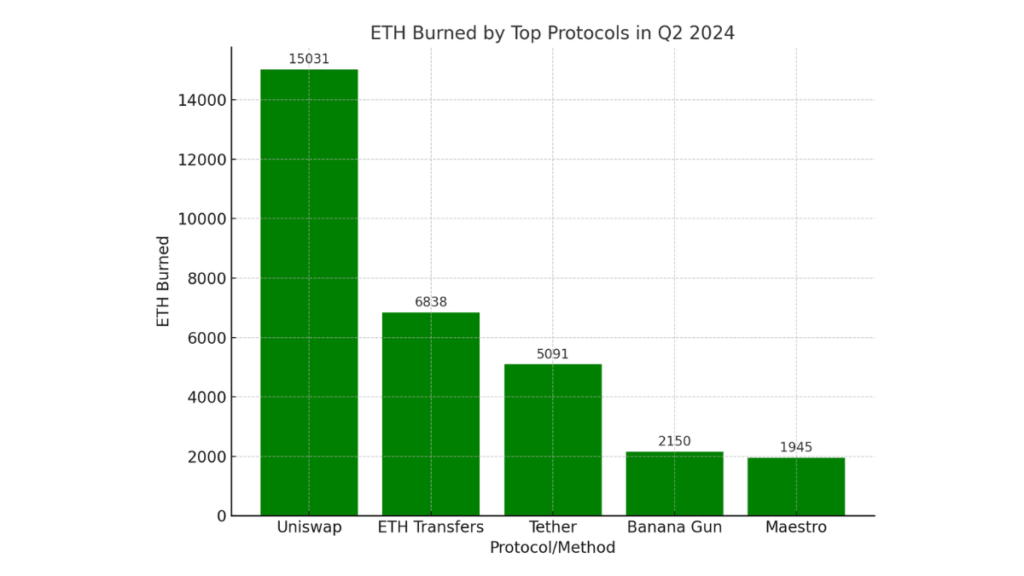
Here is a bar chart illustrating the ETH burned by the top protocols in Q2 2024. It visually represents each protocol’s contribution, showing Uniswap’s substantial lead and the smaller yet notable burns by other platforms like ETH Transfers and Tether.
Ethereum’s First Inflationary Quarter Since 2022
During the second quarter of 2024, Ethereum experienced its first inflationary quarter since 2022, marking a shift from its previous deflationary trend. With emissions outpacing burns, the total supply of ETH increased by over 120,000 ETH. This development raises concerns about Ethereum’s long-term ability to sustain deflationary pressures, particularly following the Merge, when the network transitioned to proof-of-stake.
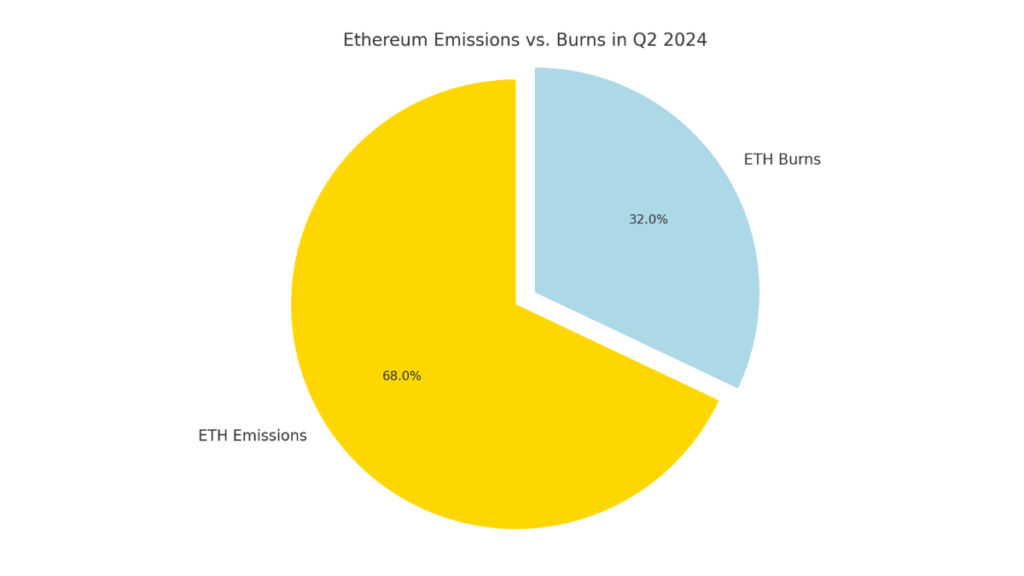
Here is a pie chart visualizing the comparison between Ethereum emissions and burns in Q2 2024. It shows that emissions far exceeded burns, causing Ethereum’s inflation.
Historical Context of Ethereum’s Deflationary Phases
After the 2022 Merge, Ethereum’s supply began to drop. This was especially true during the crypto bull market. For example, during Q1 2024, Ethereum emitted 220,454 ETH but managed to burn 333,555 ETH, resulting in a net supply reduction of over 113,000 ETH.
This continued the deflationary trend that began post-Merge. The EIP-1559 upgrade burned part of each transaction fee. However, in Q2 2024, lower network activity and gas fees caused Ethereum to add 120,818 ETH to its supply.
Factors Contributing to the Inflationary Shift
Several factors drove Ethereum’s inflationary quarter in Q2 2024:
- Decreased Gas Fees: Gas fees fell to 1.9 gwei this quarter. This cut the number of burns from transaction fees.
- Reduced Layer 1 Network Activity: A drop in transactions on Ethereum’s Layer 1 led to fewer fees being burned, further pushing the network into an inflationary phase.
- Post-Dencun Drop in Layer 2 Transaction Costs: The Dencun upgrade cut Layer 2 transaction costs. This led to fewer Layer 1 burns, increasing inflation.
Future Implications of Ethereum’s Inflationary Quarter
Following a prolonged deflationary period, Ethereum’s inflationary phase in Q2 2024 raises important questions about its economic model. With emissions now surpassing burns, the network faces challenges in maintaining its deflationary pressure, a hallmark since the Merge. As the platform evolves, protocol changes and more network activity will be key. They will decide if Ethereum can be deflationary again or if inflation will become the norm.
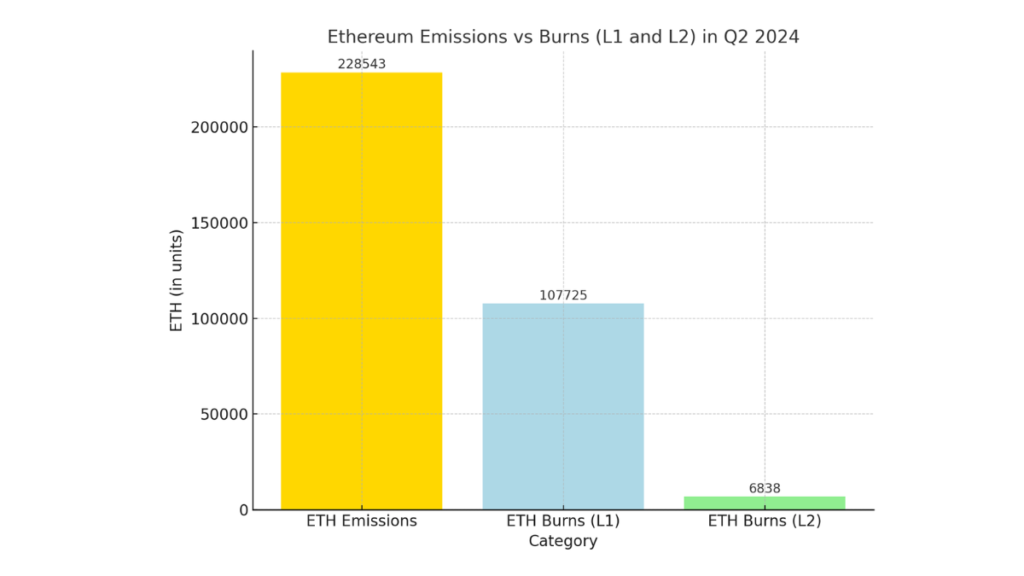
Here is a bar chart illustrating the comparison between Ethereum’s emissions and burns from Layer 1 (L1) and Layer 2 (L2) in Q2 2024. This chart highlights the large gap between the amount of ETH emitted and the smaller amounts burned on L1 and L2, which contributes to Ethereum’s inflationary trend.
Can Ethereum Return to Deflation?
Returning to a deflationary state will depend on several factors, including future protocol upgrades and a resurgence in network usage. Analysts suggest that higher transaction volumes, driven by increased activity on Ethereum’s Layer 1 and Layer 2 solutions, could reignite burns and balance emissions. For example, if fees increase due to higher demand for block space or changes in protocol (like increased fees for blobs), Ethereum might recover its deflationary status. However, the current reduced network activity and low gas fees make a swift return to deflation uncertain.
The Role of Layer 2 Solutions in Ethereum’s Supply Dynamics
Layer 2 solutions, like Optimism and Arbitrum, have improved scalability and cut costs. While these solutions reduce the cost for users, they also decrease the number of burns on Ethereum’s mainnet. This dynamic complicates Ethereum’s deflationary goals as fewer transactions on Layer 1 reduce the overall ETH burned. To address this, some community members propose increasing fees on Layer 2 blobs to generate more burns. As Layer 2 solutions grow, their impact on Ethereum’s supply will be key to curbing inflation.
Linking Suggestions
- Yield Guild Games Expands Play-to-Earn Access
- Crypto Market Reactions to Global CPI Data
- LayerAI Mainnet Rollout for Scalability
- Sonic Labs Testnet Launch
Ethereum’s shift to inflationary in Q2 2024 has sparked key debates about its economic model. With emissions exceeding burns, Ethereum faces challenges in maintaining deflationary pressure. However, as Layer 2 solutions grow and new upgrades come, the platform can recalibrate its burn-to-emission ratio. These developments will be vital for Ethereum’s growth in DeFi. Their long-term impact will affect its sustainability.
