Bitcoin’s market dominance reached significant levels in September 2024, marking its highest point in the last 2.5 years. This trend highlights Bitcoin’s growing influence within the cryptocurrency market, as its market capitalization now constitutes over half of the total cryptocurrency market cap. The resurgence of Bitcoin’s dominance can be attributed to multiple factors, including the upcoming halving event scheduled for April 2024, which historically tends to reduce supply and generate bullish market momentum. This growing dominance is crucial for understanding the broader cryptocurrency market trends, especially in relation to altcoin performance.
Overview of Bitcoin’s Market Dominance in 2024
Bitcoin’s market dominance has been a key indicator of its solidified status in the cryptocurrency market throughout 2024. The year has witnessed fluctuations in Bitcoin’s market share, ranging between 49% and 57%, highlighting Bitcoin’s resilience amidst market volatility and the growing number of altcoins. These fluctuations reflect the ongoing shifts in investor sentiment, market conditions, and the broader adoption of Bitcoin as a dominant asset in the crypto space.
Bitcoin’s dominance surged notably in response to various market events, including its performance relative to altcoins and the anticipation of the Bitcoin halving event. This trend underscores Bitcoin’s role as a market leader, often perceived as a safer investment during periods of uncertainty in the cryptocurrency market. As Bitcoin’s dominance ebbed and flowed, it continued to impact the overall market sentiment and the performance of other cryptocurrencies.
Fluctuations in Bitcoin Dominance
Throughout 2024, Bitcoin’s market dominance experienced significant fluctuations driven by a combination of market forces. At the start of the year, Bitcoin’s dominance was hovering below 50%, reflecting a period where altcoins were gaining traction. However, as the year progressed, Bitcoin’s dominance began to rise, reaching a peak of 57% in the latter part of the year. These fluctuations were influenced by factors such as market volatility, macroeconomic trends, regulatory developments, and major industry events.
For instance, the decline in Bitcoin’s dominance earlier in the year coincided with a surge in altcoin activity, particularly in decentralized finance (DeFi) and non-fungible tokens (NFTs). Investors were diversifying their portfolios into these emerging sectors, leading to a temporary decline in Bitcoin’s market share. However, Bitcoin’s dominance rebounded as market participants sought stability amid broader market corrections and regulatory uncertainties, causing a flight to safety in Bitcoin.
| Timeframe | Bitcoin Dominance (%) | Market Context |
|---|---|---|
| January 2024 | 49% | Rise in altcoin and DeFi activity |
| April 2024 (Pre-halving) | 52% | Market anticipation of Bitcoin halving |
| April 2024 (Post-halving) | 55% | Increased demand, reduced supply |
| September 2024 | 57% | Market recovery, Bitcoin ETF approvals |
The table above illustrates key points in 2024 where Bitcoin’s dominance fluctuated, aligning with significant market events. Before the halving in April, Bitcoin’s dominance rose to 52%, reflecting increased market anticipation. Post-halving, Bitcoin’s dominance further surged to 55% due to reduced mining rewards and constrained new supply.
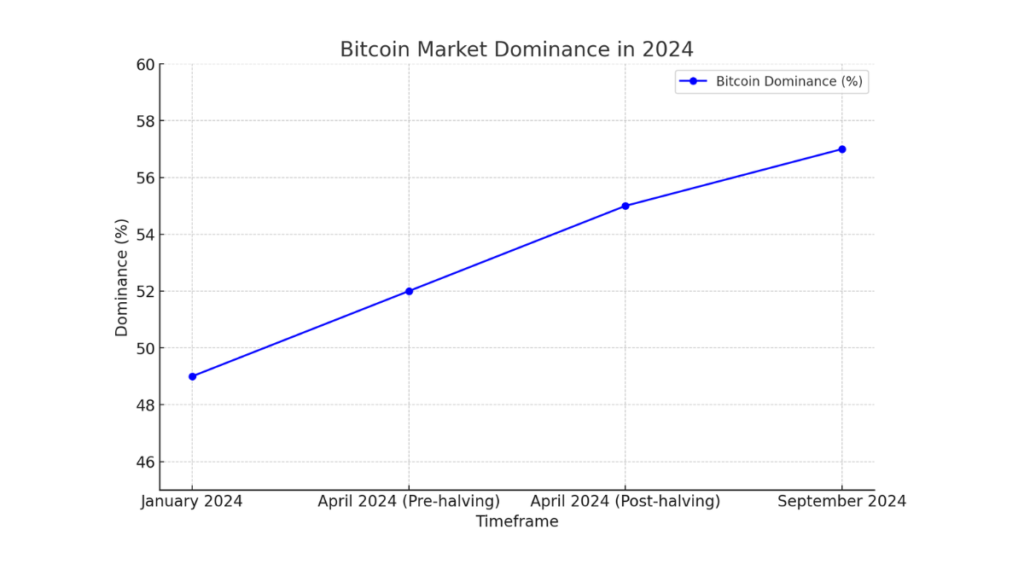
- A bar chart can be used to display the same data, with each bar representing Bitcoin’s dominance percentage at each key timeframe. This is useful for a straightforward comparison between periods.
- An area chart could represent Bitcoin’s market dominance growth over the year, emphasizing the cumulative nature of the trend.
- For a more technical analysis, a candlestick chart can show the opening, high, closing, and low dominance levels within specific periods, providing a deeper insight into the fluctuations.
Bitcoin Dominance Post-Halving Event
The April 2024 halving event played a pivotal role in reshaping Bitcoin’s market dominance. Historically, Bitcoin halvings have been associated with increased scarcity due to the halving of mining rewards, leading to a reduction in the influx of new Bitcoin into the market. This dynamic tends to bolster Bitcoin’s market share as demand outstrips the limited supply. The 2024 halving event followed a similar pattern, driving a notable increase in Bitcoin’s dominance.
Key Events Following the 2024 Halving:
- Reduced Supply: The halving cut Bitcoin mining rewards from 6.25 BTC to 3.125 BTC, decreasing the rate at which new Bitcoin entered the market. This reduction in supply contributed to the scarcity effect, supporting Bitcoin’s price and dominance.
- Increased Trading Volumes: Following the halving, Bitcoin trading volumes saw a significant uptick, indicating heightened investor interest and activity. The scarcity of new Bitcoin and the anticipation of future price appreciation fueled trading activities.
- Price Stability: Post-halving, Bitcoin’s price exhibited relative stability, bolstering confidence among investors. This stability contributed to Bitcoin’s growing market share as a store of value.
- Market Reactions: The broader market reacted to Bitcoin’s post-halving dynamics, with many altcoins experiencing declines in market cap share. Investors redirected capital into Bitcoin, perceiving it as a safer and more stable asset amidst market uncertainties.
Note
These events showcase the impact of the 2024 halving on Bitcoin’s market influence and its dominance-driven trends within the cryptocurrency market. The halving reaffirmed Bitcoin’s status as the leading digital asset, prompting shifts in market dynamics and reinforcing its position as a primary market driver.
Bitcoin Dominance and Its Impact on Altcoins
Bitcoin’s dominance within the cryptocurrency market has far-reaching effects on altcoin performance. As Bitcoin’s market dominance rises, it often signals a shift in investor sentiment toward a more conservative approach, prioritizing Bitcoin over altcoins. This dynamic can significantly impact altcoin market capitalization and trading volumes, as investors either flock to or away from altcoins in response to changes in Bitcoin’s market share. The fluctuations in Bitcoin dominance serve as a barometer for the health and sentiment of the broader crypto market, often influencing the trajectory of altcoins.
Altcoin Market Performance in 2024
In 2024, Bitcoin’s market dominance fluctuated, causing notable impacts on the performance of altcoins. During periods when Bitcoin’s dominance increased, many altcoins experienced a decline in market cap and trading volumes. For example, when Bitcoin’s market share spiked to 56.3% in April 2024, altcoins faced increased selling pressure. Many of the top twenty cryptocurrencies by market capitalization fell more than 15%, resulting in a significant loss of market share to Bitcoin. This pattern highlights the inverse relationship between Bitcoin dominance and altcoin market performance.
Historically, a rise in Bitcoin’s dominance has led to periods of consolidation in the altcoin market, often referred to as a “Bitcoin season.” During these phases, Bitcoin absorbs a larger share of the overall market cap, while altcoins generally underperform. However, this cycle tends to reverse as Bitcoin enters a period of price stability, prompting a potential “altseason” where altcoins regain strength. In 2024, altcoins have yet to witness a prolonged altseason, but market observers speculate that a reversal could be on the horizon, potentially triggered by shifts in Bitcoin’s dominance trends.
Impact on DeFi and Ethereum Tokens
Bitcoin’s market dominance has profound implications for DeFi tokens and Ethereum. As Bitcoin’s dominance rises, it can lead to a reduction in liquidity and trading volumes for DeFi tokens and Ethereum-based assets. For example, when Bitcoin’s dominance surged to multi-year highs in 2024, many DeFi tokens saw decreased activity as investors redirected capital toward Bitcoin. This shift often results in a “flight to quality,” where investors seek refuge in the relatively stable and established market position of Bitcoin.
Effects of Rising Bitcoin Dominance on Ethereum and DeFi Tokens:
- Reduced Liquidity: Higher Bitcoin dominance often leads to a liquidity drain in DeFi markets, reducing trading opportunities and impacting price stability for tokens like Ethereum and various DeFi assets.
- Market Cap Shrinkage: A surge in Bitcoin dominance can result in a decrease in the market cap of DeFi projects and Ethereum-based tokens as capital flows into Bitcoin.
- Shift in Investor Focus: Investors may prioritize Bitcoin’s stability over the higher risk associated with DeFi projects, especially during periods of market uncertainty.
- Impacted Growth: The growth potential of DeFi tokens can be constrained when Bitcoin dominance is high, as new investments are more likely to concentrate in Bitcoin rather than in riskier altcoins or DeFi protocols.
Key Observations:
While a rising Bitcoin dominance can pressure the DeFi and Ethereum ecosystems, it can also set the stage for future growth once Bitcoin’s dominance stabilizes. Historically, periods of high Bitcoin dominance have been followed by phases where capital flows back into the altcoin and DeFi markets, allowing them to recover and even thrive in subsequent cycles.
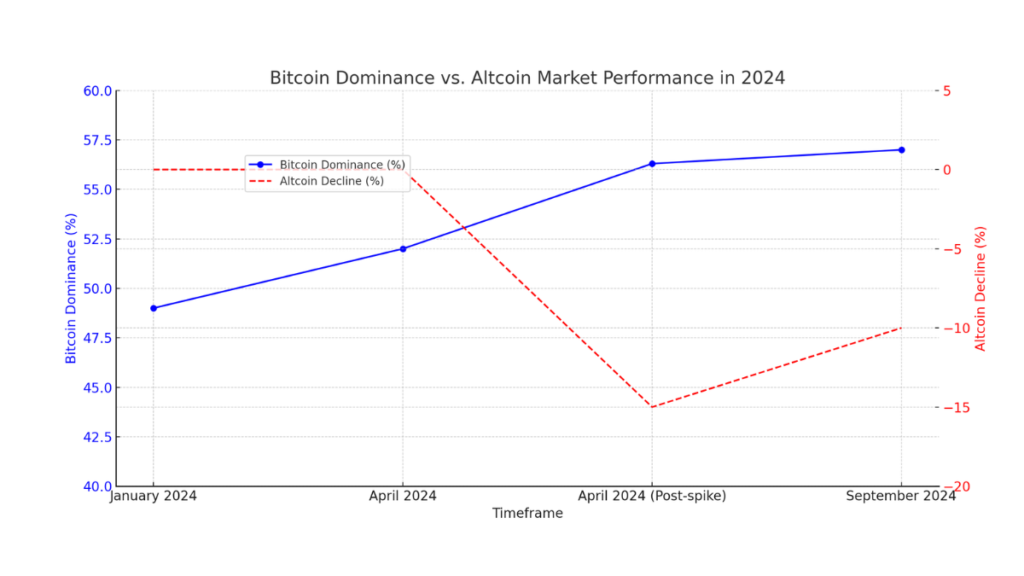
- This chart could show the distribution of market cap share between Bitcoin and altcoins over time, visually representing how the market share shifts during different periods.
- A bar chart could represent Bitcoin’s dominance at different timeframes, with an overlay line graph showing the altcoin decline. This provides a clear comparison of Bitcoin’s growth relative to altcoin performance.
- If focusing on daily or weekly changes, a candlestick chart could provide a more granular view of Bitcoin’s dominance levels and altcoin performance, showing open, close, high, and low dominance/price values.
Historical Context of Bitcoin Dominance
Bitcoin’s market dominance has seen significant changes throughout its history, reflecting the evolving dynamics of the cryptocurrency market. During the 2017 bull market, Bitcoin’s dominance soared to around 80%, a period marked by its clear leadership in the crypto space. This dominance began to decline with the emergence of numerous altcoins and the subsequent diversification of the market. By the 2021 bull market, Bitcoin’s dominance fluctuated between 50% and 60%, occasionally dipping below 50% as Ethereum and other altcoins gained prominence. The rise in the number of cryptocurrencies and the growth of alternative tokens during this period contributed to Bitcoin’s reduced market share.
In 2024, Bitcoin’s dominance has experienced a resurgence, reaching its highest level in the past 2.5 years at 54% by October. This increase in dominance indicates Bitcoin’s strengthening position ahead of the upcoming halving event scheduled (April 2024). The event will cut the mining reward from 6.25 BTC to 3.125 BTC, potentially creating a supply-demand gap that could further influence market dynamics.
Bitcoin Dominance During Past Bull Markets
Bitcoin’s dominance has varied significantly across different market cycles, notably during the 2017 and 2021 bull markets. In 2017, Bitcoin maintained a dominance of over 80%, primarily driven by its status as the pioneering cryptocurrency and the lack of strong competitors. At that time, Ethereum, the second-largest cryptocurrency, had a market dominance of approximately 10%–17%. The market dynamics shifted in 2021, as Bitcoin’s dominance dropped to the 50%–60% range. This decline was due to the emergence of numerous altcoins and decentralized finance (DeFi) projects, which attracted significant investor interest and capital, leading to a more diversified market landscape.
In contrast, 2024 has seen Bitcoin’s dominance rise again, reaching a peak of 58% by April before stabilizing around 54% in the lead-up to the halving event. This resurgence highlights Bitcoin’s continued influence and its role as a safe haven for investors amid market uncertainties. The trend also suggests that, despite the growth of altcoins, Bitcoin remains a dominant force in the market, often absorbing capital during periods of heightened market volatility.
| Year | Bitcoin Dominance (%) | Market Context |
|---|---|---|
| 2017 | 80% | Dominance over altcoins, early market |
| 2021 | 50% – 60% | Rise of altcoins and DeFi projects |
| 2024 (April) | 58% | Pre-halving, market uncertainty |
| 2024 (October) | 54% | Approaching next halving, market consolidation |
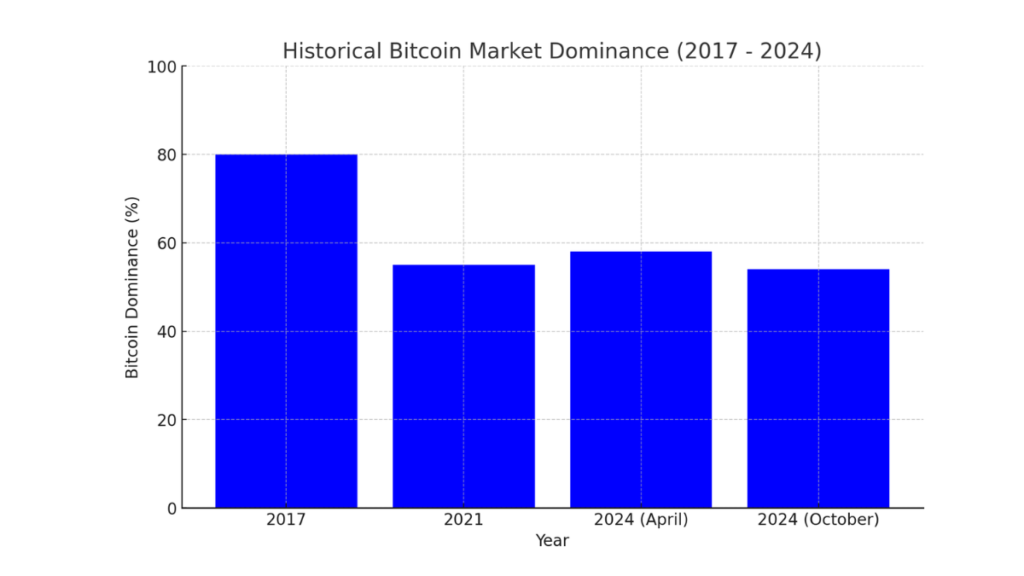
- A line chart can be used to show the changes in Bitcoin dominance over time, providing a clearer view of the trends and shifts across the years.
- This could visualize the proportion of Bitcoin dominance in comparison to the total market cap, alongside altcoins, over the selected time periods.
- For a more detailed view, a candlestick chart could display Bitcoin dominance fluctuations within each year, showing the opening, closing, high, and low dominance levels.
Decline and Resurgence of Bitcoin Dominance
The decline of Bitcoin’s dominance post-2020 can be attributed to the rapid growth of the cryptocurrency market and the proliferation of altcoins. As new projects entered the space, offering various utilities such as DeFi, NFTs, and smart contract platforms, investors began diversifying their portfolios. This trend led to Bitcoin’s market share dropping below 50% at times during the 2021 bull market.
However, starting in mid-2022, Bitcoin’s dominance began to resurge, driven by several factors. The growing regulatory scrutiny on certain altcoins, market corrections, and the search for stability led investors to consolidate their assets in Bitcoin, often seen as a safer and more established option. By 2024, Bitcoin’s dominance had reached its highest point since April 2021, hovering around 54%-58%. This resurgence is indicative of Bitcoin’s enduring appeal and its role in shaping market trends, particularly in anticipation of major events like the upcoming halving.
Real-Time Bitcoin Dominance Data and Market Implications
Monitoring real-time Bitcoin dominance data is crucial for understanding market trends and investor sentiment. Bitcoin’s dominance is a measure of its market capitalization relative to the total cryptocurrency market cap, and fluctuations in this metric often serve as indicators of shifts in market dynamics. By observing real-time dominance data, traders and analysts can gain insights into how capital is flowing between Bitcoin and altcoins, helping them anticipate potential market movements.
Analyzing Real-Time Dominance Data
As of the latest data, Bitcoin’s market dominance reached 54% in October 2023, the highest in over 2.5 years. This surge was driven by several factors, including market anticipation of the upcoming Bitcoin halving event scheduled for April 2024. In the weeks leading up to this dominance spike, Bitcoin experienced a double-digit percentage surge in price, rising from just below $27,000 to a yearly high of $35,000. This rise in dominance indicates a market preference for Bitcoin over other cryptocurrencies, highlighting its role as a safe-haven asset during times of market uncertainty.
| Date | Bitcoin Dominance (%) | Total Market Cap (Trillion USD) |
|---|---|---|
| June 19, 2023 | 50% | 1.1 |
| October 26, 2023 | 54% | 1.24 |
| November 2023 (Current) | Approx. 54% | 1.3 (estimated) |
These numbers demonstrate Bitcoin’s increasing influence in the market, particularly amid growing regulatory scrutiny and macroeconomic uncertainties. Market participants have been increasingly looking to Bitcoin as a safer investment, resulting in a notable impact on the market capitalization of altcoins and other cryptocurrencies.
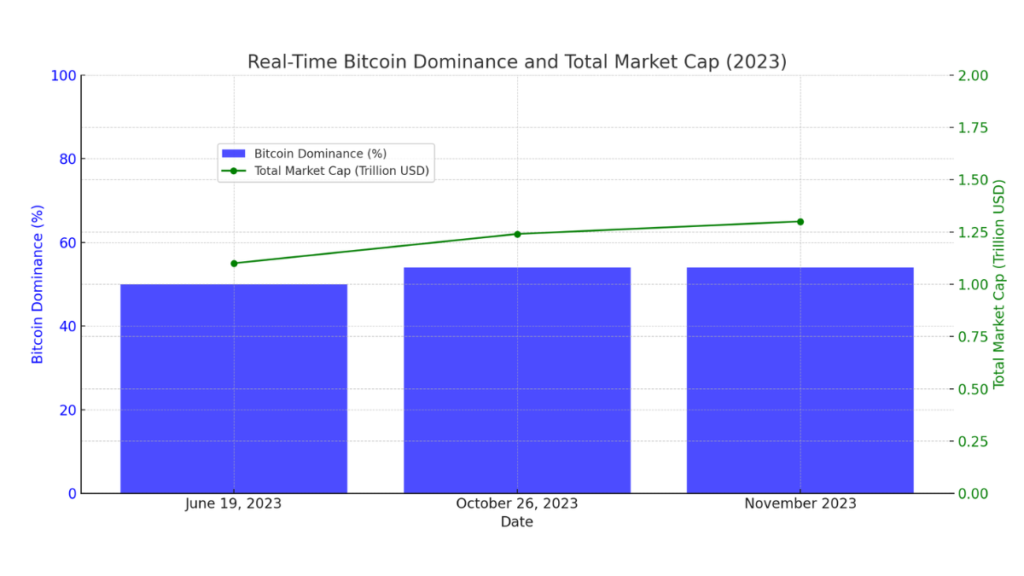
- This could show the market cap distribution between Bitcoin and the rest of the market over time, providing a visual breakdown of Bitcoin’s market share compared to altcoins.
- A line chart could effectively display both Bitcoin’s dominance and total market cap trends over time, highlighting how changes in dominance correlate with shifts in market cap.
- An area chart could represent the cumulative market cap, with one area showing Bitcoin’s share and the other representing altcoins, emphasizing the changing proportions.
Implications for Market Volatility
Changes in Bitcoin’s dominance can significantly impact market volatility. For instance, when Bitcoin’s dominance surged to 54% in October 2023, many altcoins experienced renewed price pressure, with some top cryptocurrencies by market cap declining by more than 15%. This trend highlights how shifts in dominance can lead to a reallocation of capital within the crypto market, often resulting in increased volatility for altcoins.
Market volatility driven by Bitcoin’s dominance can also be observed in its price movements. Historically, when Bitcoin’s dominance rises, it often signifies a more risk-averse market sentiment, leading investors to consolidate their holdings in Bitcoin. Conversely, a decline in Bitcoin dominance can signal a “risk-on” environment where investors seek higher returns through altcoins, which can lead to increased trading activity and market volatility across the board.
This dynamic is evident in the market’s reaction to major events like Bitcoin’s halving or regulatory actions. For example, the rise in dominance following regulatory scrutiny in the U.S. and the aftermath of the FTX crisis in 2022 pushed investors towards Bitcoin, contributing to its increased dominance in 2023. This behavior suggests that monitoring real-time Bitcoin dominance is crucial for predicting periods of heightened market volatility and understanding broader market trends.
Future Outlook of Bitcoin Dominance
Bitcoin’s dominance in the cryptocurrency market is currently at its highest point in over 2.5 years, reaching 54% in late 2023. This trend is driven by various factors, including the upcoming Bitcoin halving event, increasing institutional interest, and regulatory developments. The future outlook for Bitcoin dominance is likely to be influenced by these elements, which may impact the broader market landscape in 2024 and beyond.
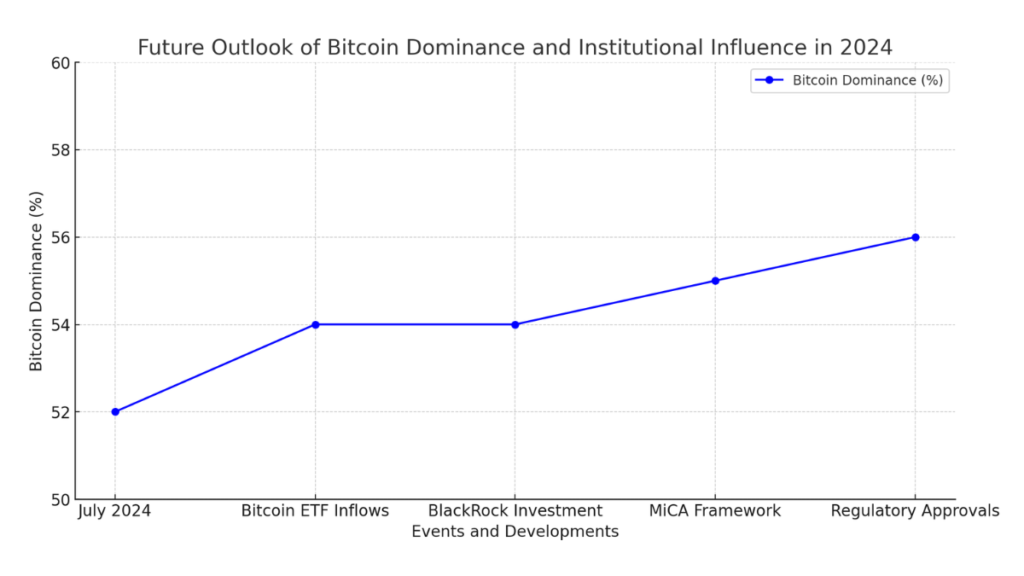
- A bar chart could represent Bitcoin dominance before and after each significant event, highlighting the impact of each factor on its market share.
- This can display the distribution of institutional interest, retail interest, and regulatory influence on Bitcoin dominance, providing a multi-dimensional view.
- For a more detailed technical analysis, a candlestick chart could be used to show Bitcoin dominance fluctuations within each event period, capturing high, low, open, and close dominance levels.
Influence of Institutional Interest
Institutional interest in Bitcoin has surged significantly, particularly in 2024, with developments such as the approval of Bitcoin exchange-traded funds (ETFs) and an increase in investments by major financial entities. For example, July 2024 marked a period of heightened interest in Bitcoin ETFs, with billions of dollars in net inflows. BlackRock’s iShares Bitcoin Trust recorded substantial investments, and other prominent institutions like Fidelity have also entered the Bitcoin market through various products and services. These inflows indicate a growing confidence in Bitcoin as an asset class, contributing to its rising dominance in the market.
Furthermore, institutional adoption is reshaping investment strategies, with reports showing that a standard portfolio including a small allocation of Bitcoin has yielded significantly higher returns compared to traditional portfolios. The approval of Bitcoin ETFs in major markets like the U.S. has paved the way for more institutional participation, which is expected to have a lasting impact on Bitcoin’s market dominance in the future.
Bitcoin Dominance in a Maturing Market
As the cryptocurrency market matures, Bitcoin’s dominance may continue to evolve. In 2024, global interest in blockchain and cryptocurrencies has surged, partly due to new regulatory frameworks and mainstream adoption of blockchain technology. For instance, the European Union’s Markets in Crypto-Assets (MiCA) framework and the approval of Bitcoin and Ethereum ETFs have provided a supportive regulatory environment, encouraging broader integration of blockchain into the global financial system. This environment has led to greater institutional and retail interest, which could sustain or even increase Bitcoin’s market dominance.
Moreover, technological advancements and developments within the Bitcoin ecosystem, such as the introduction of Bitcoin-based Layer 2 networks, have expanded its utility beyond just a store of value. As Bitcoin continues to integrate into traditional finance and expand its use cases, it is likely to maintain a strong influence on the overall market cap. However, this growing dominance could face challenges from emerging altcoins and decentralized finance (DeFi) projects, which also aim to capture a share of the market.
Related Articles
- Current Bitcoin Price Trends
- Impact of US Inflation Data on Crypto
- Ethereum Market Performance
- Crypto Market Volatility Updates
Bitcoin’s market dominance in 2024 reflects a dynamic interplay of institutional interest, technological advancements, and regulatory developments. As the cryptocurrency market matures, Bitcoin continues to assert its influence, with recent trends indicating a more integrated role in traditional finance. This evolving landscape highlights the importance of staying informed on how Bitcoin’s dominance shapes the broader market and impacts altcoin performance.


